Reading your dashboard
Make sense of statuses, response times, and incidents.
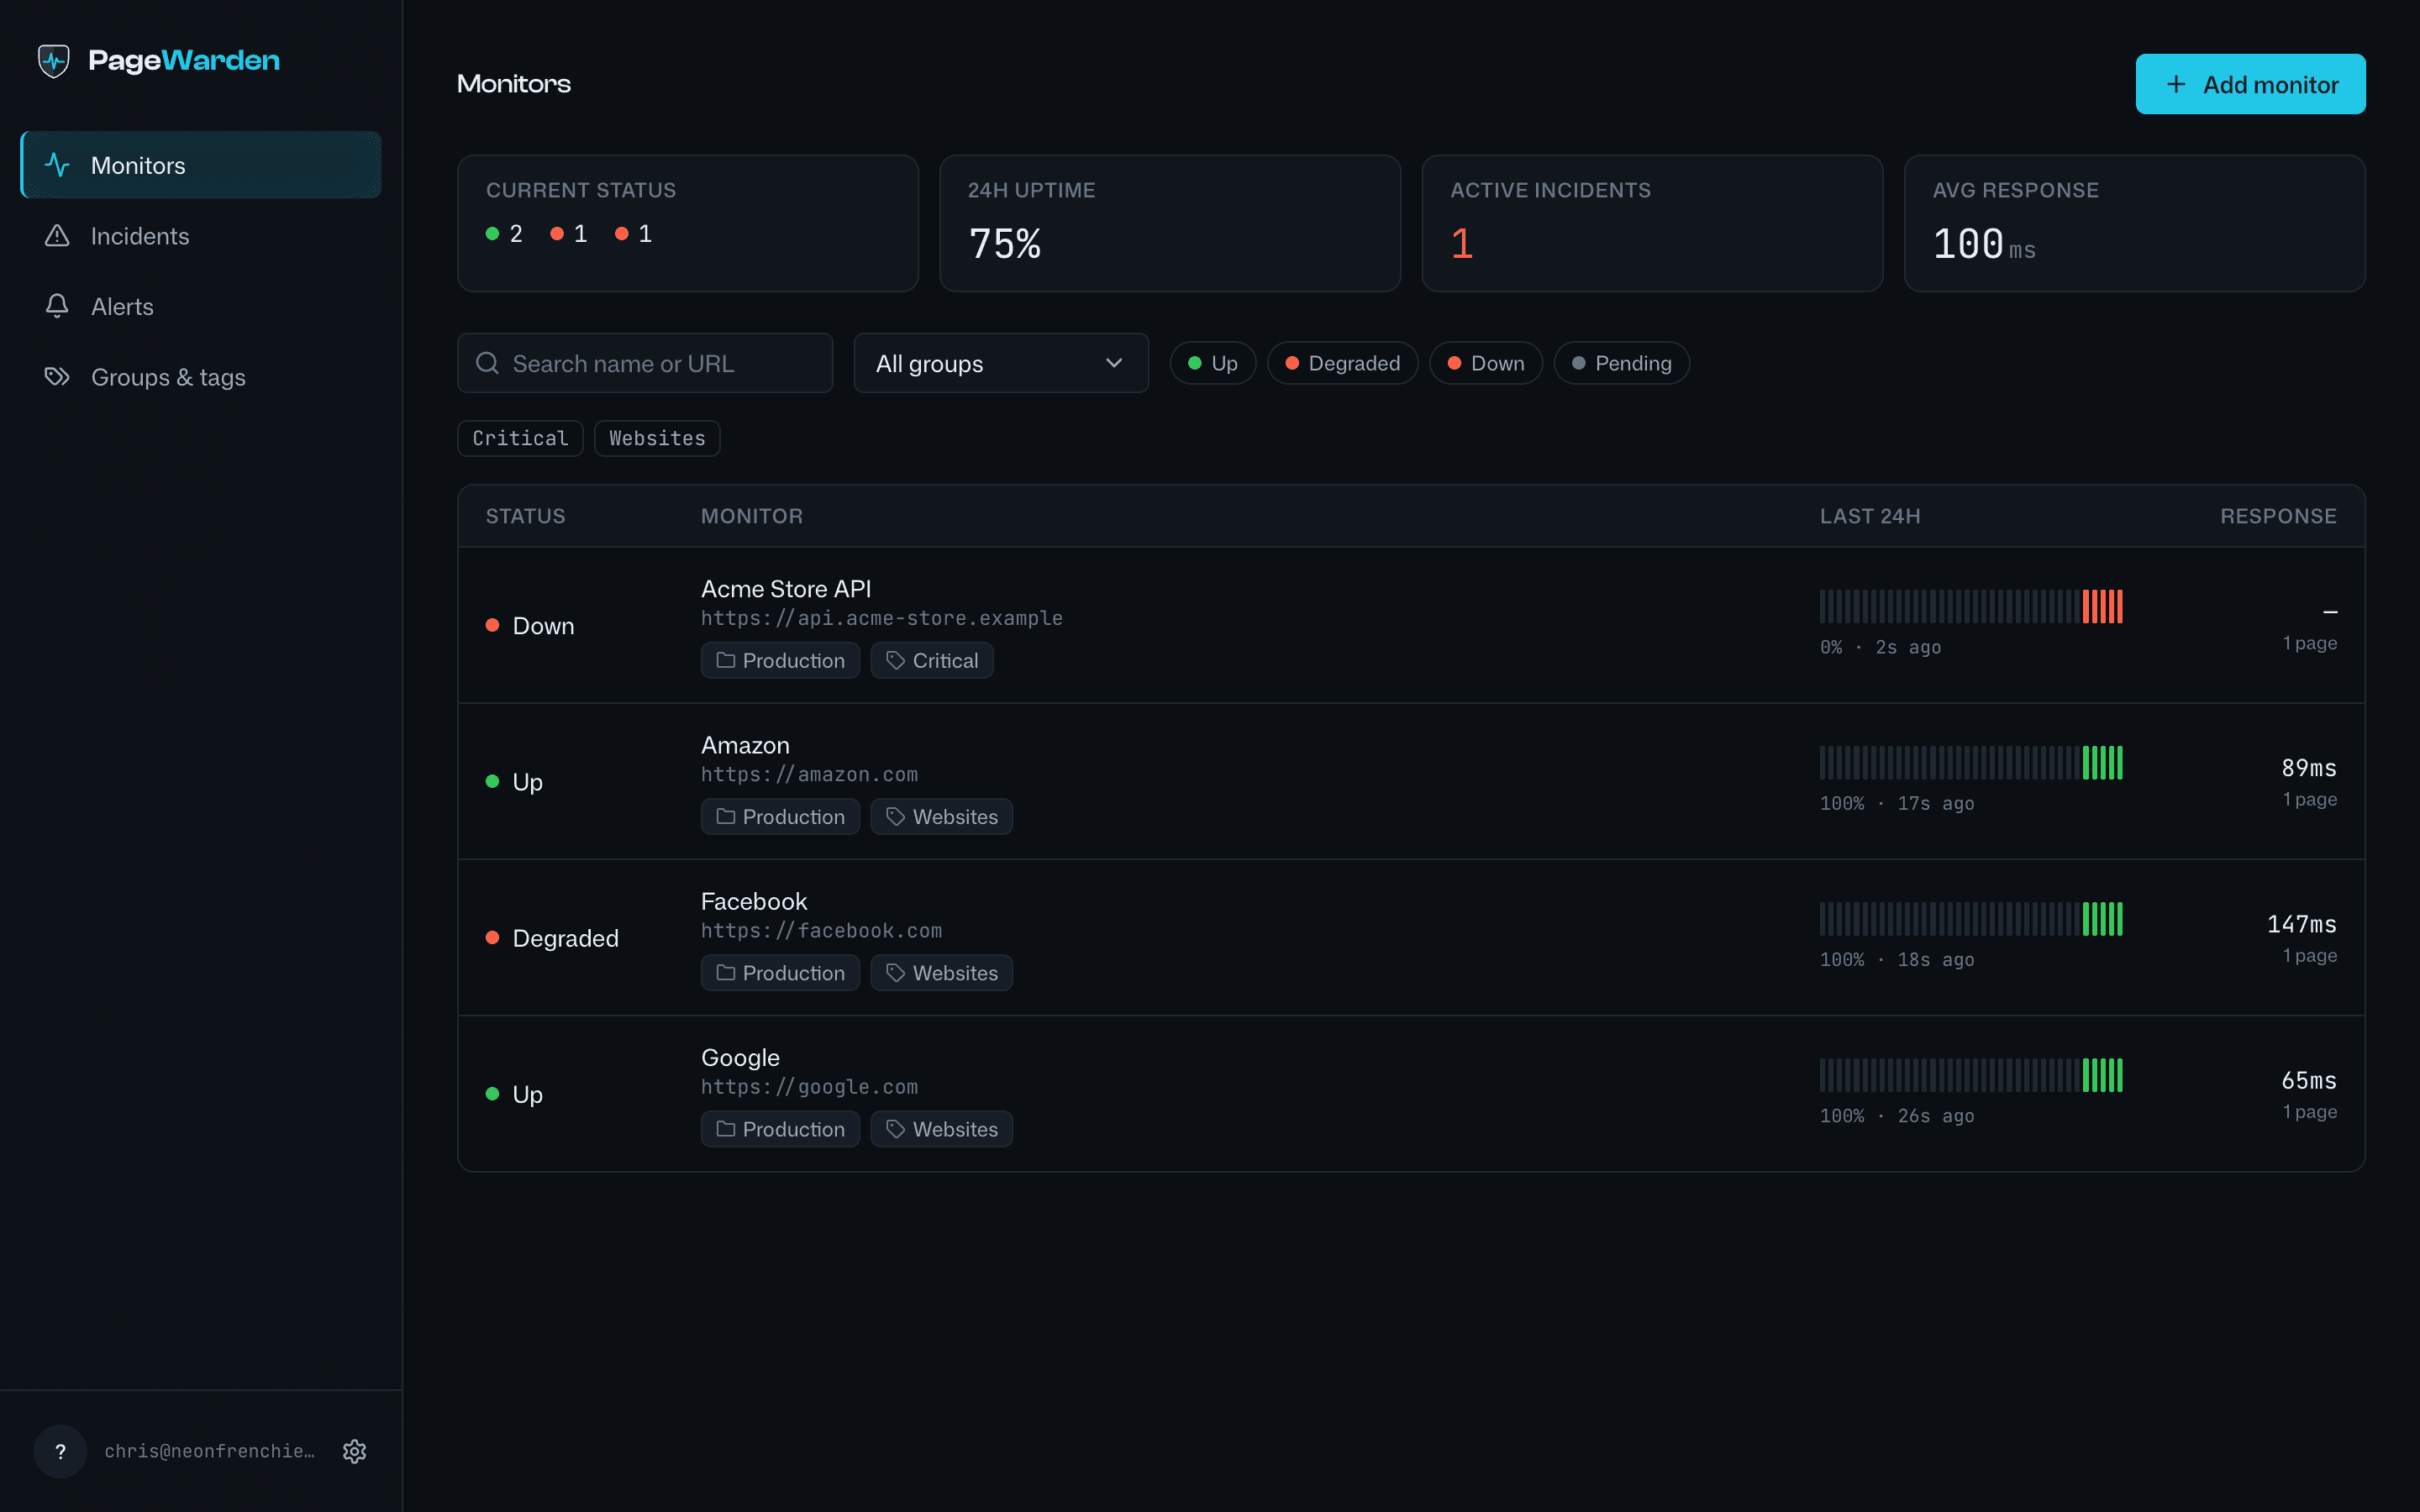
Your dashboard is the single place to see how everything is doing at a glance.
Statuses
Each monitor shows a status:
- Up means the most recent check passed. Green is used only for a genuine, confirmed up state, so when you see green you can trust it.
- Degraded means the monitor is answering but not cleanly, for example partial packet loss on a ping or a failure seen from only some regions. It is a warning worth a look, short of a full outage.
- Down means a check failed and PageWarden confirmed the failure. An incident is open and your alerts have fired.
- Pending means the monitor is new or has not completed its first check yet.
- Paused means checks are turned off for that monitor and no alerts will fire.
You can filter the dashboard by status to focus on just the monitors that need attention.
Response time
For website and reachability checks, PageWarden records how long each check took,
shown in milliseconds (for example 243 ms). The dashboard shows an average, and
each monitor has a chart of response time over its history. A slow, climbing line
is often an early warning before an outage.
Incidents
When a monitor goes down, PageWarden opens an incident and timestamps it. When the monitor recovers, the incident closes and records how long it lasted. Open a monitor to see its incident history and, on Starter and Pro, a plain-English diagnosis of the likely cause.
The Incidents page in the sidebar collects every incident across all your monitors in one list, newest first. Open one for the full detail, and select Acknowledge to mark that someone is handling it, separately from whether it has recovered yet.
History
How far back you can look depends on your plan, from 14 days on Free up to 90 days on Pro. See the plan comparison.